The Trace Library and the Interactive Debugger
In this chapter we will learn about the Trace Library and the Interactive Debugger
Loading the Trace library
To start using the Trace library, We must load it first!
load "tracelib.ring"
Trace All Events
The next example demonstrates the Trace library usage to trace all events.
# Trace All Events
trace(:AllEvents)

see "Hello, world!" + nl
see "Welcome" + nl
see "How are you?" +nl

mytest()

new myclass { mymethod() }

func mytest
        see "Message from mytest" + nl

class myclass
        func mymethod
                see "Message from mymethod" + nl
Trace control flow between functions
The next example demonstrates the Trace library usage to trace the control flow between functions.
Trace(:Functions)

test1()

func test1
        see :test1 + nl
        test2()

func test2
        see :test2 + nl
        see test3() + nl

func test3
        see :test3 + nl
        return "test 3 output"
Pass Error
The next example demonstrates the Trace library usage to pass an error!
Trace(:PassError)

test1()

func test1
        x = 10
        see :test1 + nl
        test2() # Runtime Error!
        see "We can continue!"
Interactive Debugger
The next example demonstrates the Trace library usage to use the Interactive Debugger
Trace(:Debugger)

test1()
see "good bye!" + nl

func test1
        x = 10
        see :test1 + nl
        t = 12
        test2() # Runtime Error!
        see "After Error!" +nl
        see "t = " see t see nl
        see "x = " see x see nl
Execute Program Line by Line
The next example demonstrates the Trace library usage to execute the program line by line!
Trace(:LineByLine)

test1()

func test1
        x = 10
        see :test1 + nl
        t = 12
        test2()
        see "After Error!" +nl
        see "t = " + t + nl
BreakPoint
The next example demonstrates the Trace library usage to stop at a breakpoint!
test1()

func test1
        x = 10
        see :test1 + nl
        t = 12
        BreakPoint()
        see "After breakpoint!" +nl
        see "t = " + t + nl
        see "End of program!" + nl
Disable BreakPoints
The next example demonstrates the Trace library usage and how to disable the Breakpoints!
NoBreakPoints()

test1()

func test1
        x = 10
        see :test1 + nl
        t = 12
        BreakPoint()
        see "After breakpoint!" +nl
        see "t = " + t + nl
        see "End of program!" + nl
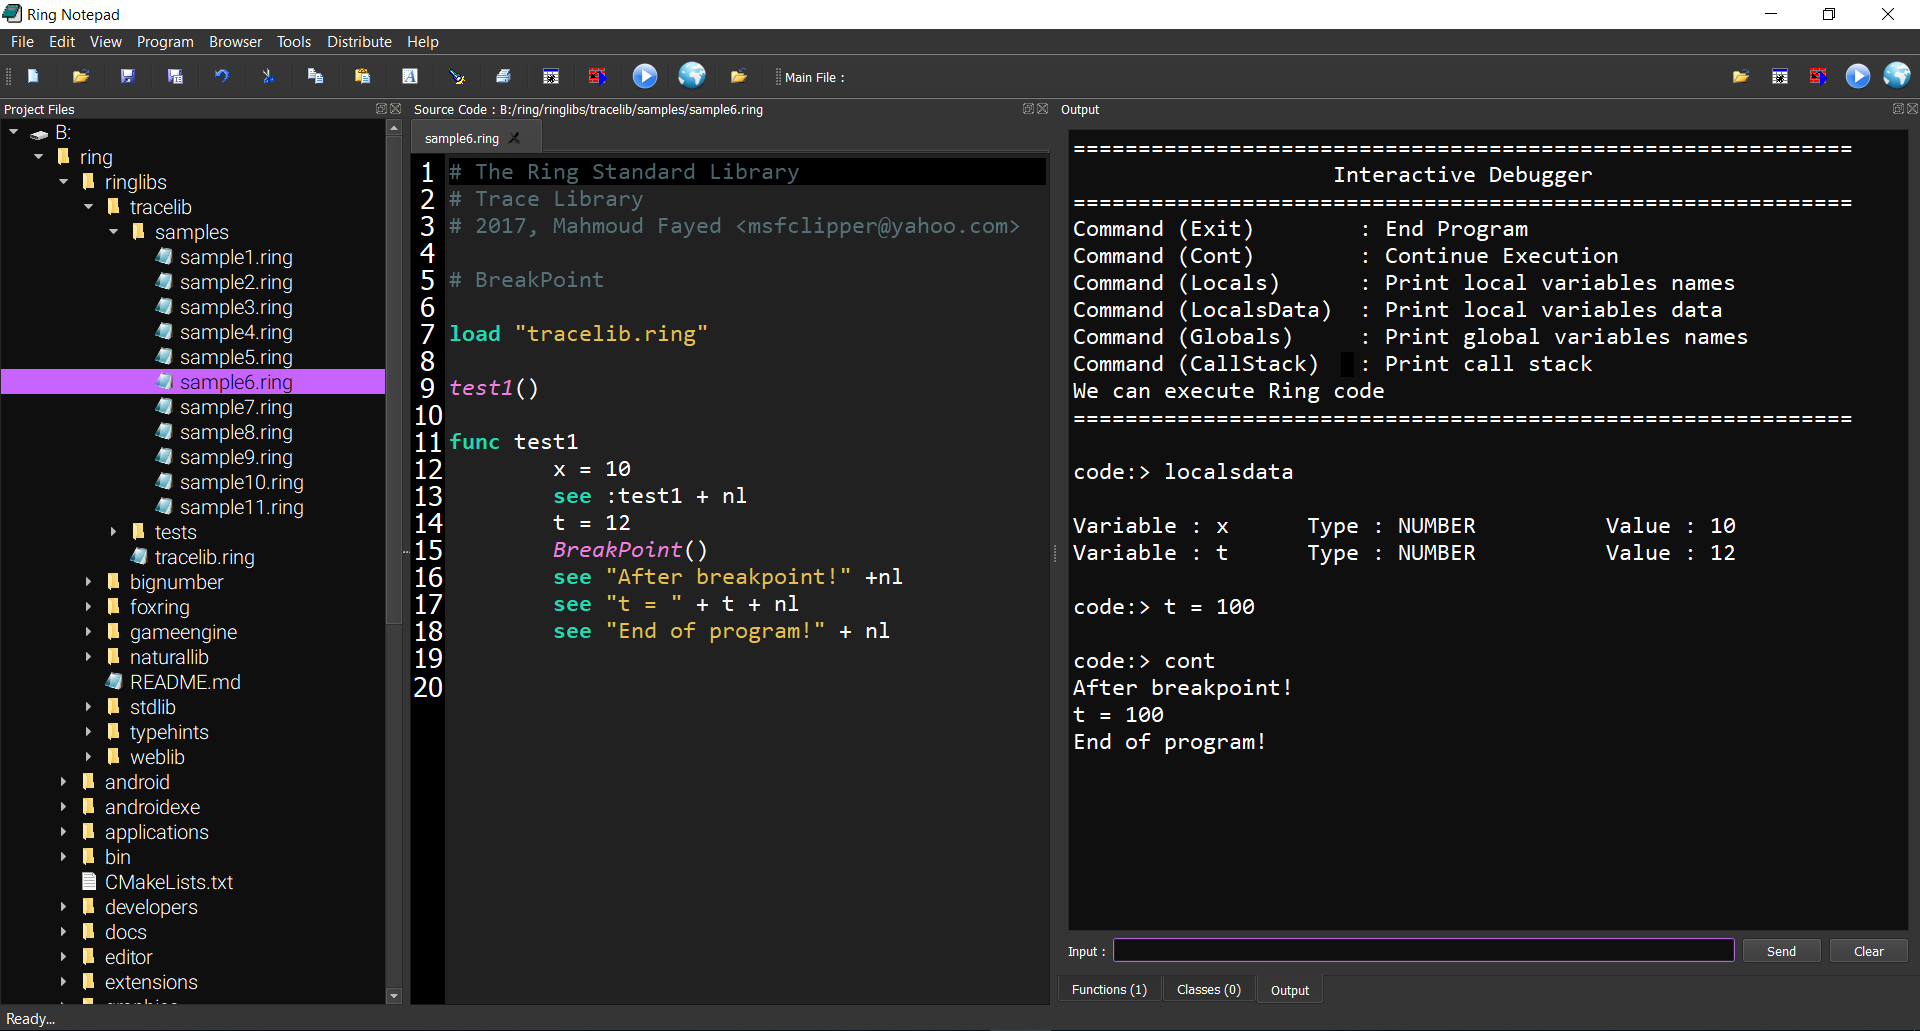
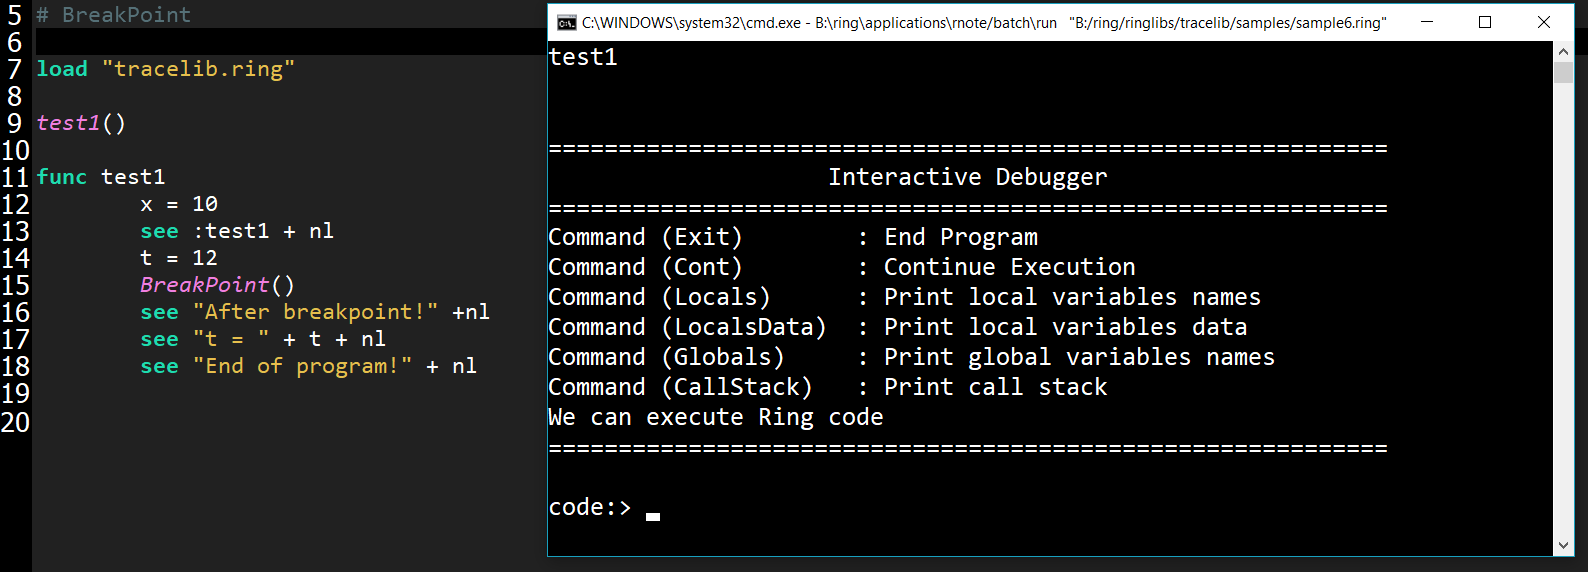
Using the Interactive Debugger
The next example uses a Breakpoint to open the Interactive Debugger!
load "tracelib.ring"

test1()

func test1
        x = 10
        see :test1 + nl
        t = 12
        BreakPoint()
        see "After breakpoint!" +nl
        see "t = " + t + nl
        see "End of program!" + nl
Screen Shots:
We have the Interactive Debugger at the Breakpoint!
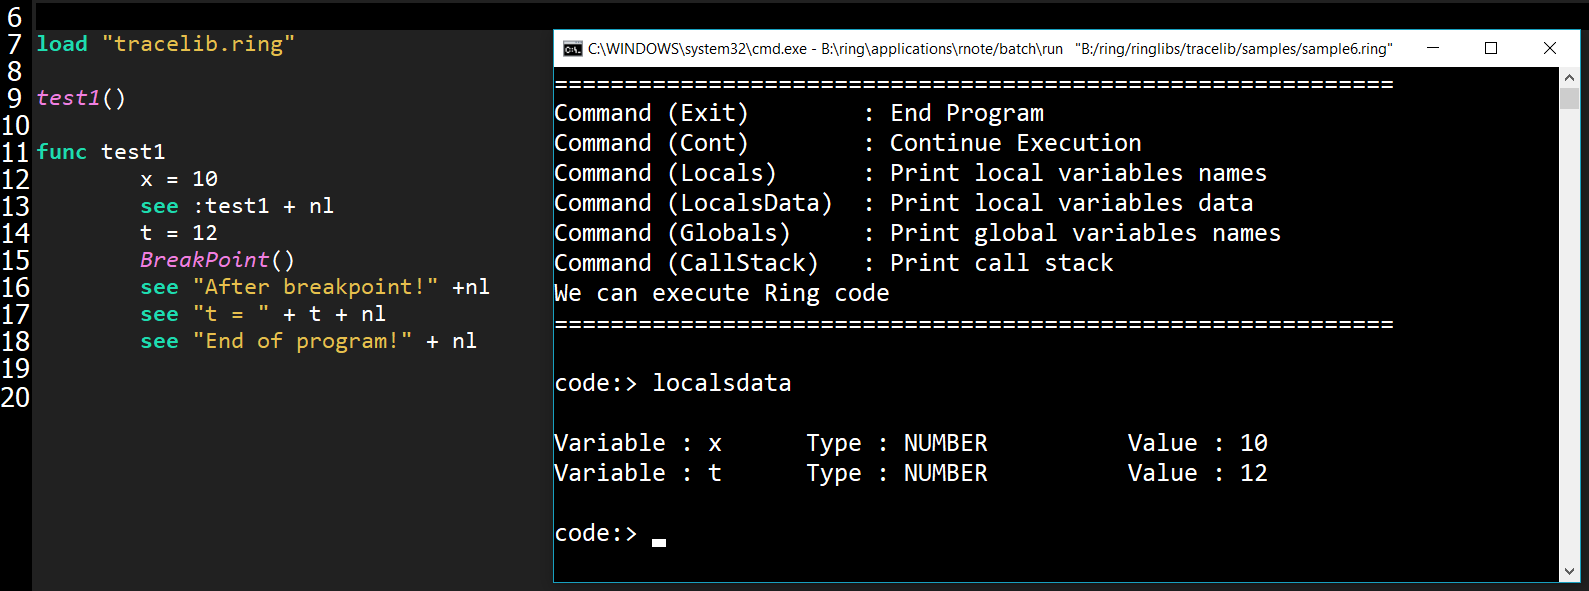
We can print the variables values
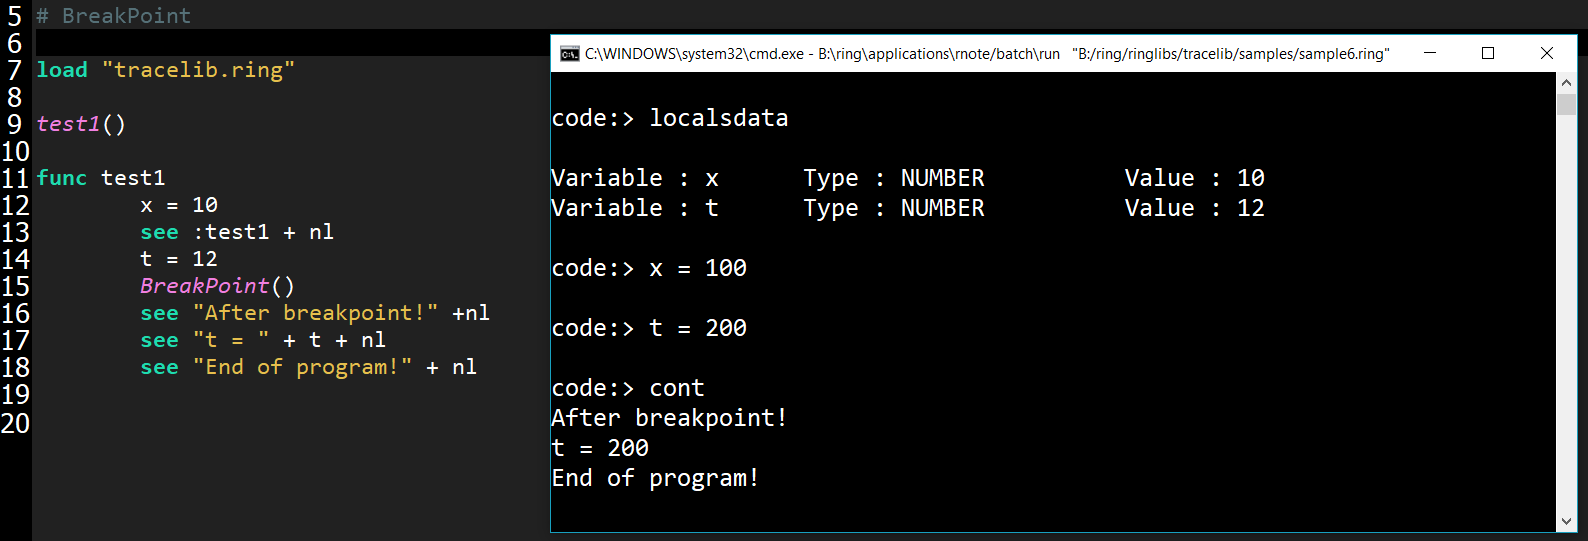
We can change the variables values then continue execution
We can run the Interactive Debugger in the Output Window